- Overall shop prices reported deflation for the fifteenth consecutive month, accelerating to 1.9% in July.
- This is the deepest level of deflation since the series began in December 2006.
- Food inflation fell to 0.3% in July – the lowest ever recorded.
- Non-food reported deceleration in deflation of 3.3% in June from 3.4% in June.
Helen Dickinson, British Retail Consortium Director General, said: “Shop price deflation deepened still further in July and marked fifteen consecutive month of falling shop prices for consumers. This is great news for households who are benefitting from fierce competition within the industry at a time when disposable incomes remain under pressure.
“The lowest ever recorded food inflation will be particularly welcomed by the lowest income households who typically spend around a third of their expenditure on food. Deep and widespread discounting across the grocery sector is intensifying with prices falling almost one per cent month-on-month – another record jump. After accounting for the use of multi-buys and vouchers, food prices are falling.
“Against a backdrop of stable commodity markets, the stronger sterling making imports cheaper and wavering retail spending, current levels of deflation are expected to continue. While this is great news for consumers, trading conditions across the industry remain challenging. Structural changes in retail are challenging existing business models which in many cases are squeezing margins while other costs, such as business rates, continue to rise.
“While we know retailers will be working hard to sustain low prices, continued support from Government will be key to maintaining a sustained recovery in the economy.”
Mike Watkins, Head of Retailer and Business Insight, Nielsen, said: “There is very little food inflation at the moment and this looks set to continue over the summer. Many supermarkets are reducing prices across ambient and seasonal fresh foods, which is helping shoppers make further savings on household bills. And on the non-food high street, retailers are maintaining the level and depth of price cuts and promotions to help drive footfall over the holiday period.”
Overview
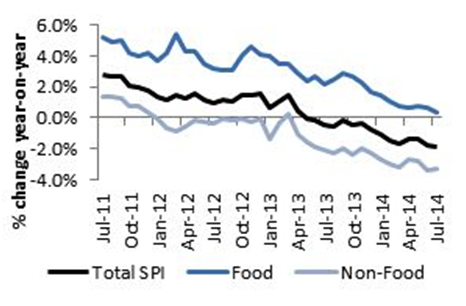
The BRC-Nielsen Shop Price Index (SPI) reported annual deflation of 1.9% from 1.8% in July, accelerating deeper than the twelve month average rate of 1.1%. This is the deepest rate of deflation since the series began in December 2006. Food inflation is also at a record low falling to 0.3% in July, while non-food deflation accelerated to 3.3% from 3.4% in June.
BRC-Nielsen Shop Price Index
Source: BRC
Food inflation is at its lowest level since the inception of the Monitor in December 2006. Fresh food inflation fell to 0.3%, below the twelve and three month average of 1.5% and 0.5%, respectively. The rate of inflation within the Ambient food category fell from 0.7% to 0.2% in July, the lowest rate since the series began. Overall food inflation has averaged just 1.5% over the last twelve months and 0.6% in the last three months.
The prices of the majority of the agricultural commodities that we follow closely fell over the second half of 2014, with the main exception being cattle. The price of coffee has fallen back since its surge earlier this year as fears about damage to Brazil’s coffee crop receded once the harvest there began. However, the price of sugar has remained near its recent high. The price of cocoa also spiked at the beginning of the year, although it has raised slightly again recently. This rise in the price of cocoa has been mainly driven by poor weather, pests and disease in West Africa, especially in the Ivory Coast which produces around 40% of the world’s crop. What’s more, there are signs of strong growth in demand as global economic growth picks up. Oil prices remained stable over most of the second quarter of this year. The global outlook for rising commodity prices remains modest.
Source: FT. *Prices as of July 11 to match reporting period
* Oil fell by 1% both y-o-y and over last 3 months
The Thomson Reuters/CoreCommodity CRB Index, a weighted commodities benchmark, was down 4.0 per cent in the 3 months to the end of our Survey period (July 11). Most of its downward movement was due to good weather and ample supplies in the US which pulled down the prices of the major grains and soybeans.
Thomson Reuters/CoreCommodity CRB Index
The official measure of inflation, the Consumer Price Index (CPI) grew by 1.9% in June, up from 1.5% in May. Upward pressure came from the transport services costs category, notably air fares, particularly European routes. Price changes in clothing and footwear also contributed to the upward pressure rising by 0.6% between May and June this year compared with a fall of 1.9% a year ago. Food price inflation also picked up in June and contributed close to 0.1 percentage points to the rise in the headline inflation rate. But a further significant rise in food inflation from June’s 0% rate seems unlikely, given that global agricultural commodity prices have fallen in recent months and the price competition between supermarkets is building. It is the belief of some city analysts that CPI inflation could ease to as low as 1% by the end of this year and will remain comfortably below the 2% target in 2015. This would support the recovery in real consumer spending and strengthen the case for keeping official interest rates on hold until the second half of next year.
On the consumer front, recent announcements from key grocery players suggests that fierce competition on prices and promotions, particularly on essential items, is set to continue, ensuring shop price inflation remains at low levels in the coming months. The latest BRC-KPMG Retail Sales Monitor reported a fall in sales of 0.8% on a like-for-like basis but up 0.6% on a total basis. Excluding Easter distortions, this is the lowest total growth recorded since May 2011. However, the three-month average is in line with the twelve-month average of 2.5%
Despite media controversy about the number of price cuts versus price increases on grocery lines, the figures show that the more affordable products have generated greater volumes than the others, creating some overall downwards price pressure. Non-Food reported growth in line with the twelve-month average of 3.7% over the last four months – which irons out Easter distortions.
The cost of living has eased marginally for families in the UK as the average household had £171 a week of discretionary income <http://www.ibtimes.co.uk/uk-cost-living-eases-family-spending-power-continues-rise-says-asda-1449751> in June 2014, up £1 a week year-on-year. Discretionary incomes rose year-on-year for the ninth consecutive month, but at a slower rate than previous months. Brighter prospects for the UK economy have helped contribute to the strengthening of sterling which has in-turn made imports cheaper. British retailers are passing on these benefits to their consumer with new lower prices. With the backdrop of stable commodity markets, strengthening of sterling and benign pressures in the supply chain, low inflation looks set to continue in the medium term bar any supply chain shocks. The producer price index (inflation faced by retailers) remains very low, with output prices felling by a monthly 0.2% in June and were just 0.2% higher than a year ago.
Shop Price Inflation Annual % Change, Food and Non-food Contribution
Food
In July, food inflation fell to 0.3% from 0.6% in June, falling below its twelve month average of 1.5%. Food inflation remains at its lowest since the series began in December 2006.
On a month-on-month basis, prices fell by 0.7%, after being flat the previous month.
Fresh Food
Fresh food inflation fell in July to 0.3%, below the twelve month average of 1.5%. Upward pressures came from the oils & fats, milk, cheese and eggs and fish all reporting inflation above the overall fresh food category. Downward pressure came from the meat, fruit, convenience food and vegetables categories.
On a month-on-month basis prices fell by 0.7% after a 0.1% fall in June.
Ambient Food
Ambient food inflation slowed to 0.2% from 0.7% in June, which is the lowest level of inflation since the series began. Downward pressure came from the non-alcoholic beverage, the sugar, jam, honey and syrup, bread and cereals categories, all reporting deflation in July. Inflation in alcoholic beverages was above the category average.
On a month-on-month basis prices fell by 0.6% from a 0.2% rise in June.
Non-food
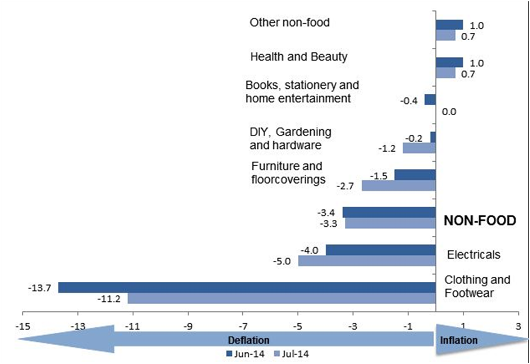
Non-food deflation decelerated to 3.3% from 3.4% in June. Downward pressure was exerted by four sub-categories, all of which reported annual deflation in July. Furniture & Floorcovering, Electricals and DIY, Gardening and Hardware experience accelerated deflation, while Clothing and Footwear experienced decelerated deflation. The year-on-year price changes in Books, Stationary and Home Entertainment was flat this month while Health & Beauty and Other Non-Food were the only categories to experience inflation but at a decelerated rate.
On a month-on-month basis prices fell by 0.8% from a 0.6% fall in June.
Year-on-year changes in non-food by sector
Clothing & Footwear
June experienced a fall in the level of deflation in the Clothing and Footwear category reaching 11.2% from 13.7% in June. All sub-categories experienced deflation in July with children’s and men’s clothing more deflationary than the category average. Footwear, other clothing and baby clothing and women’s clothing all experienced a lower deflation rate than the category average. The Clothing and Footwear category has a three and twelve month average of 12.1% and 10.9% respectively.
On a month-on-month basis prices fell 1.0% after a 3.3% fall in June.
Furniture & Floorcovering
In July, deflation in the Furniture and Floorcoverings category accelerated to 2.7% from 1.5% in June, above both the twelve and three month averages of 1.9% and 1.7% respectively. The house textiles experienced decelerated deflation, while the furniture, furnishing and carpet category experienced accelerated deflation in July. Gross mortgage lending was £17.5bn in June, up 4.3% on May’s figures and up 17.3% compared to June 2013. In the year to July, prices rose by 10.6%, the fourth month of double-digit growth this year although slowing slightly from June’s rate. Once again, the figures hide a sharp contrast between London and the rest of the UK.
Prices fell 2.4% on a month-on-month basis from a 0.2% rise in June.
Electricals
Deflation in the Electricals category accelerated to 5.0% in July from 4.0% in June. Both the household appliances and the audio and visual equipment category reported acceleration in its deflation rates. The GfK ‘climate for major purchases’ index fell one point in July to -3, but still considerably higher than last year. Consumer credit increased by £0.7 billion in May, up 5.4% on the previous year.
On a month-on-month basis, prices fell 1.3% from a 0.6% fall in June.
DIY, Gardening and Hardware
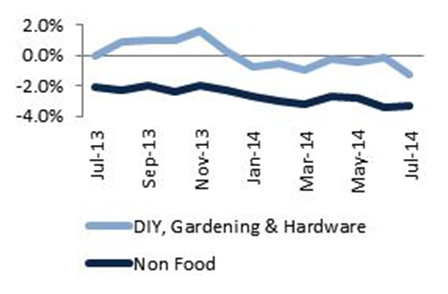
The DIY, gardening and hardware category remained in deflationary territory in July, with a 1.2% fall in prices over the year, below its three month average of 0.6%. The tools and equipment for the house was the driver in the deflation rate, glass, tableware and household utensils entered deflationary territory in July.
On a month-on-month basis prices fell 0.2% in June after a 0.2% fall in June.
Books, Stationery and Home Entertainment
Inflation in the Books, Stationery and Home Entertainment category was flat this month, above the twelve and three month average which reported deflation of 0.4% and 0.2% respectively. Home entertainment and the stationery category reported deflation while books and newspapers entered the inflationary category.
On a month-on-month basis prices rose 0.2% after a 0.2% fall in June.
Health & Beauty
The Health and Beauty category reported annual inflation of 0.7% in July from 1.0% in June. Personal care contributed to the downward pressure on the overall inflation rate, while toiletries & cosmetics experienced deceleration in its inflation rate.
On a month-on-month basis, prices fell 0.6% after rising 0.8% in June.
Other non-food
The Other Non-Food category reported annual inflation of 0.7%, down from 1.0% in May.
On a month-on-month basis price changes in June were flat.
Methodology
The SPI is administered by Nielsen, who collate and analyse the data on behalf of the BRC.
The index provides an indicator of the direction of price changes in retail outlets. The BRC launched the Shop Price Index to give an accurate picture of the inflation rate of 500 of the most commonly bought high street products in stores.
As the Index is designed to reflect changes in shop prices, the sampling points chosen are five large urban areas, spread nationally. Not all sample stores are in city centres; they have been selected to reflect local shopping habits. Therefore, the sample includes superstores on out-of-town sites, town centre department stores, local parade stores, and shopping centres. In each location, Nielsen collect and process the data for the BRC, visit stores of differing types, e.g. grocery, confectionery, DIY, department stores - including small and large multiples and independents. Data collection is monthly and always in the same stores to maintain consistency.
The items for which prices are collected reflect standard consumer purchasing patterns in terms of branded/own label split and price distribution. The Index is constructed of seven main sectors of purchase: food, DIY, gardening and hardware, furniture, books, stationery and home entertainment, electrical, clothing and footwear, and other non-food. In total there are 500 items representing the seven main sectors, there are around 6,500-7,000 price points collected each period. Each product class category has an individual weighting based on the “All households” expenditure measured in the Family Expenditure Survey. This data is also used to weight the Office for National Statistics Retail Price Index (RPI).
Although it is a proxy measure of inflation, the Shop Price Index is more focused than the Retail Price Index, and demonstrates the extent to which retailers contribute to inflation through their pricing of a range of commonly bought goods.